
Infographics as a Creative Assessment
|
|
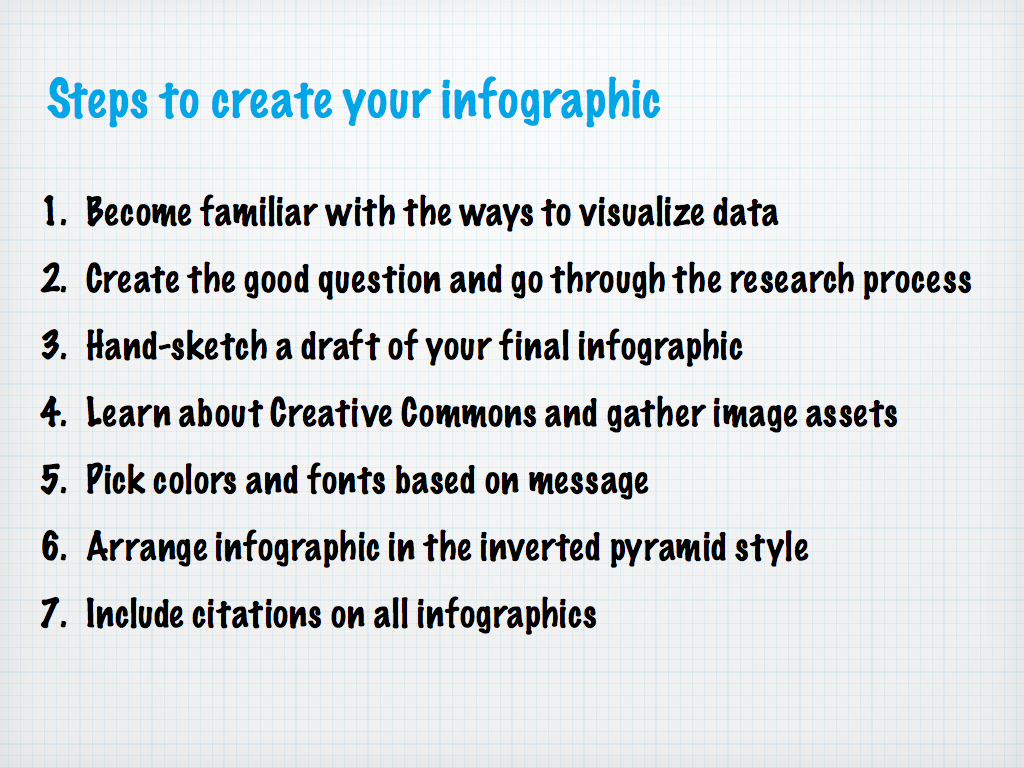
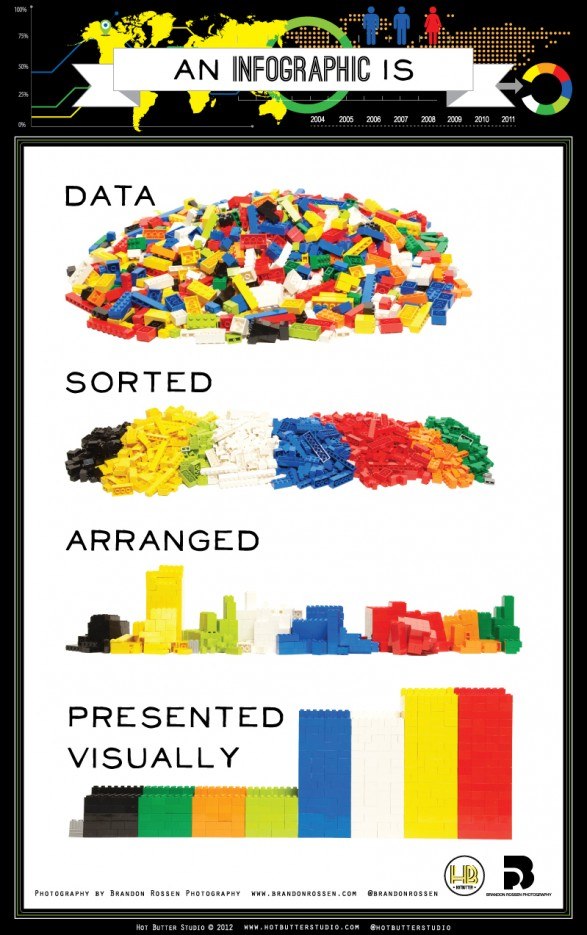
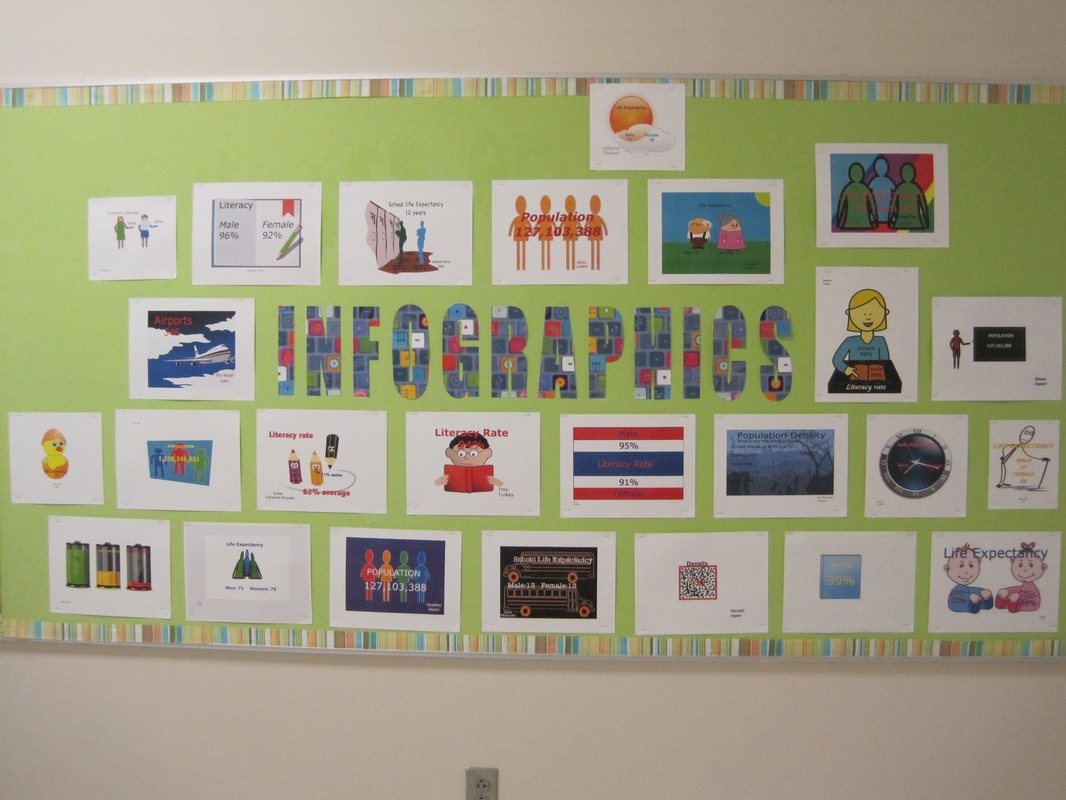
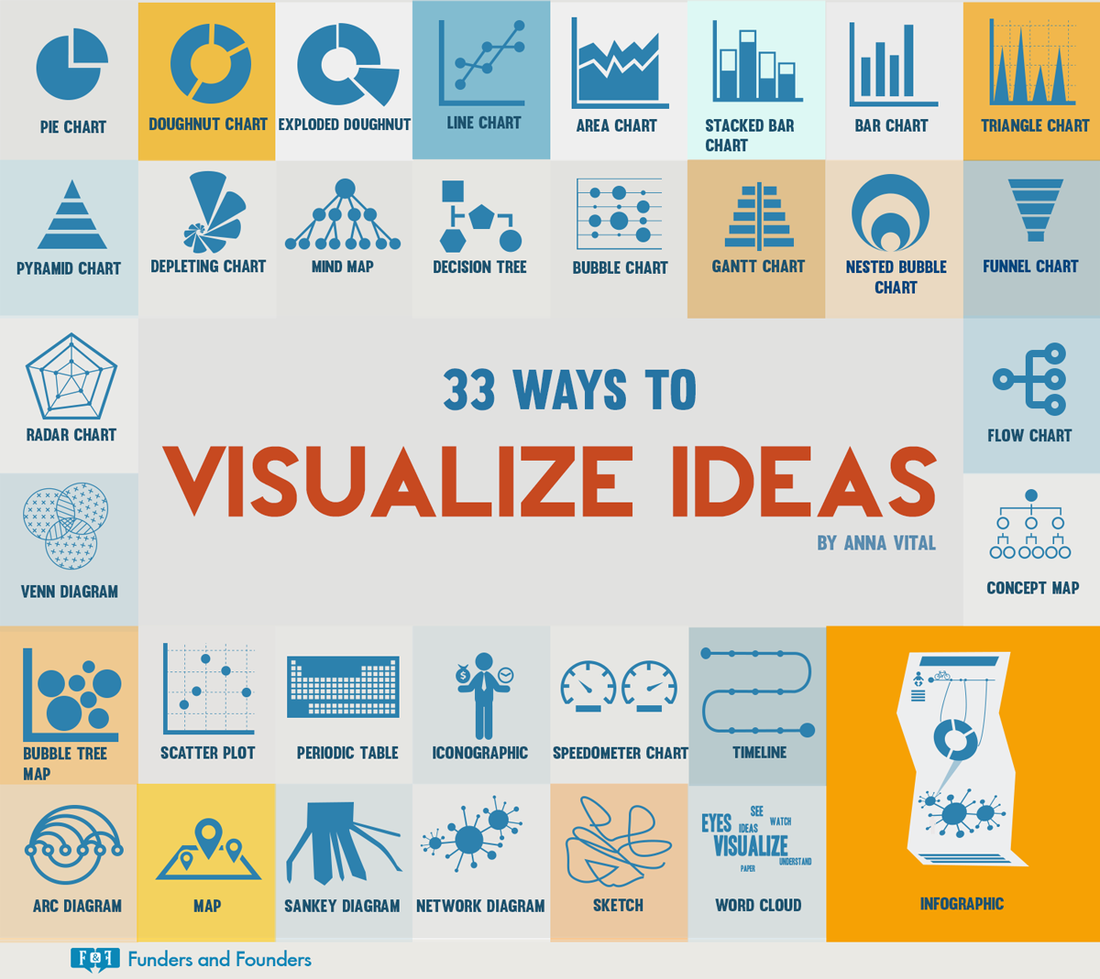
Infographics are a visual representation of data. When students create infographics, they are using information, visual, and technology literacies. This page includes links to help you develop formative or summative assessments that have students creating infographics to showcase their mastery of knowledge.
If you find a link that is not working, please let me know the title and I will fix it! Thank you! |
BOOKS ON THE TOPIC
|

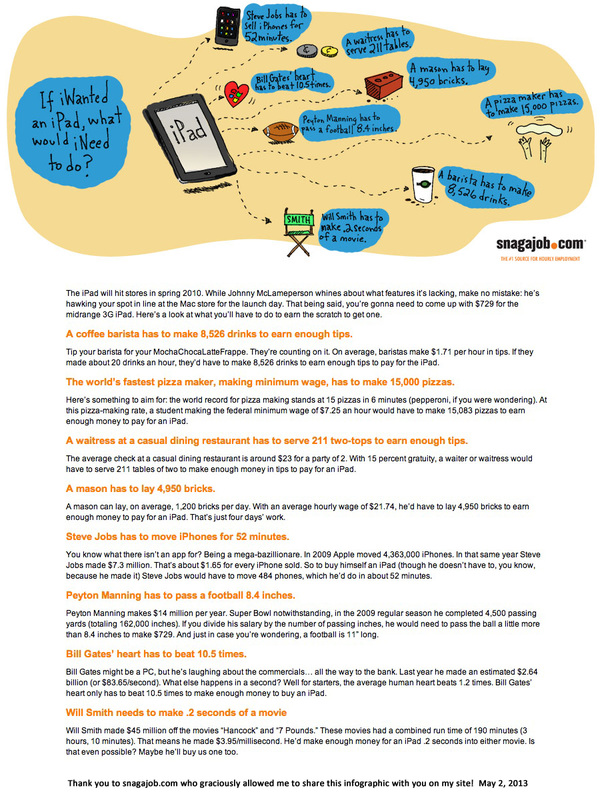
There are hundreds of infographics on the Web. One fun activity is to conduct a Google phrase search of "topic infographic" or "infographic about topic" and see what shows up!
Here is a list of topics to start with that will lead you to some very cool infographics!
Here is a list of topics to start with that will lead you to some very cool infographics!
|
01. Education infographic
02. Computer infographic 03. Coupon infographic 04. iPad infographic 05. Coffee infographic 06. Twitter infographic 07. Facebook infographic 08. Movie infographic 09. Financial infographic 10. Fast food infographic 11. College infographic 12. Automobile infographic 13. Immigration infographic 14. Consumer spending infographic 15. Disease infographic 16. Dog infographic 17. Football infographic 18. Presidents infographic 19. Debt infographic 20. Resume infographic |
21. NCAA infographic
22. Cooking infographic 23. Internet infographic 24. Green infographic 25. Apps infographic 26. Infographic infographic 27. Population infographic 28. Apple infographic 29. Microsoft infographic 30. Higher ed infographic 31. Email infographic 32. Election infographic 33. Math infographic 34. Communication infographic 35. Social media infographic 36. Teacher infographic 37. Travel infographic 38. Industrial infographic 39. Space infographic 40. Television infographic |
|
|
Copyright: Kathy Schrock. All rights reserved.
Republishing of these lists of links without express and written permission from this site's author is not allowed. Links to this page may be used, provided that full and clear credit is given to Kathy Schrock and Kathy Schrock's Guide to Everything with appropriate and specific direction (via the URL) to the original compilation of information on this page. Permissions beyond the scope of this license may be available by emailing the creator. |
Kathy Schrock (kathy@kathyschrock.net) URL: https://schrockguide.net/infographics-as-an-assessment.html Page created: 10/16/2010 Last updated: 04/01/2024 |
